
We've already had a glimpse at using advanced tools for experiments in Albian genealogy.
Gephi is a nice tool for interactively browsing decently sized datasets on the macro scale, but what about more conventional genealogy tools ?
In this post I will show you basic use of graphviz in python to make some more traditional but far more detailed family trees automatically.This will once again be only a short glimpse at graphviz possibilities so we can use it as an useful tool further down the road.
Hopefully it will make you want to add this to your Albian explorer toolbox.
In the preceding genealogy article we used the "Gamelog" file as a source for Norn filliation information.
Building upon the history file parsing article, we will now be using the History files to get and display more information in a single shot.
But what's graphviz anyway ?
Graphviz is a library for managing, and generating visualisations of graph data.We will be manipulating it with python through the pydot wrapper.
In it's simplest form, a graph is a collection of nodes (elements) and edges (links between nodes).
After installing graphviz and pydot (in that order, it will save you some trouble later on), generating a graph is as simple as doing:
import pydot
tree = pydot.Dot(graph_type='digraph')
tree.add_edge(pydot.Edge("Mother", "Child 1"))
tree.add_edge(pydot.Edge("Mother", "Child 2"))
tree.add_edge(pydot.Edge("Father", "Child 1"))
tree.add_edge(pydot.Edge("Father", "Child 2"))
tree.add_edge(pydot.Edge("GrandMother", "Father"))
tree.add_edge(pydot.Edge("GrandFather", "Father"))
tree.write_png('Familytree.png')
This automatically dumps a "Familytree.png" in the script's current folder :

Don't like PNGs ? replace tree.write_png('Familytree.png') with
tree.write_pdf('Familytree.pdf') to get a more browsable format with selectable text.
Using Graphviz boils down to setting up a manageable nodes and edges list, and letting python do it's magic for us.
In this simple example, we've only created edges, while the library automatically updated the nodes list for us whenever an unknown node was specified.
As we will need further control over the nodes shapes, we will have to manage them manually further down the road, but that's not a big deal.
Making graphs from actual Creatures data:
The next step will be gathering the genealogy information from the game data.As seen in the preceding article, we will extract the relevant information from the game's History files.
We will be building upon our last article's code for parsing history files.
Grab Historyfileparser.py and put it in the same folder as your future script.
This only a slightly modified version of the code shown in the preceding post. It will make importing your whole Norn population information inside your future programs a one-line magic trick such as in :
import Historyfileparser
print Historyfileparser.Norns.keys()
Which will gladly output you a list of all your creatures monikers:
['8KPO', '6ILB', '4WFW', '2TAV', '8CWN', '7SRX', '6TFX', '7TML', '5CHG', '0BLT']
Using that magic, we can now easily make a quick graph of all our Albian population:
import pydot
import Historyfileparser
tree = pydot.Dot(graph_type='digraph') # Digraph means "oriented links"
#print Historyfileparser.Norns["1KTQ"]
for moniker in Historyfileparser.Norns.keys():
print moniker,":", Historyfileparser.Norns[moniker]["DadMoniker"],Historyfileparser.Norns[moniker]["MumMoniker"]
tree.add_edge(pydot.Edge(Historyfileparser.Norns[moniker]["MumMoniker"], moniker))
if Historyfileparser.Norns[moniker]["DadMoniker"]!="":
tree.add_edge(pydot.Edge(Historyfileparser.Norns[moniker]["DadMoniker"], moniker))
tree.write_png('./ActualFamilytree.png')
You can grab the corresponding python file here: Simplemonikerfamilytree.py
And here is our family tree automatically generated right from the game data :
 | |||
| Remember 4XSW ? He's the result of our eggfile generating experiments ! |
 |
The answer is that it works in C2 but not in C1.Anyway you shouldn't need to do that, as you can always specify a "0" father genome if you want to make a mono parental child.
Making it cuter
Alright, so far this makes a lot of work for not much more than we could have made using Gephi, so what's the big deal ?Graphviz is much more configurable regarding what we can make our nodes look like.
What about something like this?

This was generated using :
import pydot
import Historyfileparser
import datetime
def makelabel(Norn):
label="{"+Norn["Name"]
label+="\n("+moniker+")|{"
label+="Born: "+datetime.datetime.fromtimestamp(Norn["TimeOfBirth"]).strftime('%Y-%m-%d %H:%M:%S')+"|"
if Norn["TimeOfDeath"]!=0:
label+= "Dead: "+datetime.datetime.fromtimestamp(Norn["TimeOfDeath"]).strftime('%Y-%m-%d %H:%M:%S')+"}"
else:
label+="-"+"}"
label+="|{"+Norn["State"]+"}"
label+="}"
return label
tree = pydot.Dot(graph_type='digraph',rankdir="LR") # Digraph means "oriented links"
Nodes=[]
for moniker in Historyfileparser.Norns.keys():
print moniker,":", Historyfileparser.Norns[moniker]["DadMoniker"],Historyfileparser.Norns[moniker]["MumMoniker"]
lab=makelabel(Historyfileparser.Norns[moniker])
if Historyfileparser.Norns[moniker]["Gender"]=="male":
Nodes.append(pydot.Node(moniker,shape="record",label=lab,style="filled", fillcolor="lightblue"))
else:
Nodes.append(pydot.Node(moniker,shape="record",label=lab,style="filled", fillcolor="pink"))
tree.add_edge(pydot.Edge(Historyfileparser.Norns[moniker]["MumMoniker"], moniker))
if Historyfileparser.Norns[moniker]["DadMoniker"]!="":
tree.add_edge(pydot.Edge(Historyfileparser.Norns[moniker]["DadMoniker"], moniker))
for node in Nodes:
tree.add_node(node)
tree.write_png('./FullColoredFamilytree.png')
This was barely more complicated, we only added a bit of formatting to the cells.
You could use any of the available information and present it in any shape you like.
The label shape specification supports some basic HTML inspired syntax so you can design your nodes as HTML tables containing arbitrarily formatted text and images.
I had to arrange the tree vertically so it fits on the page, but here's a more natural view (sorry about the size issues):

You see those white bubbles ? Those are nodes we didn't explicitly create from Histfiles, meaning that no Norn with that genome ever walked our Albia, but rather these were merely mentioned as a reference in a Norn's parent information.Pretty convenient.
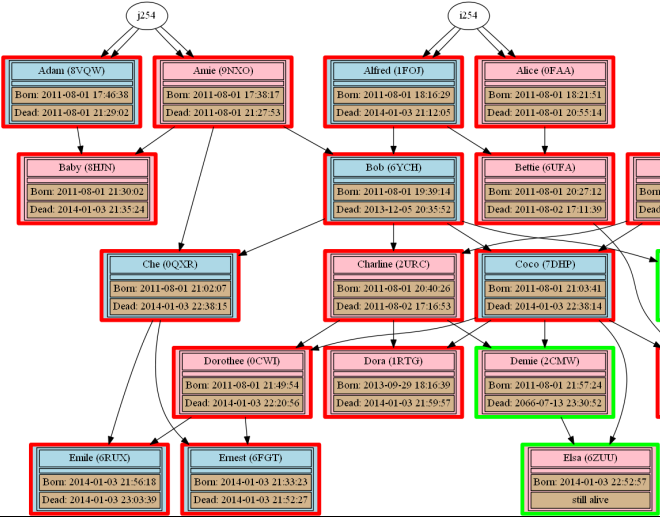
By using the following script, we can further improve the model and cram some more data in our nodes,making them a more complete and usable genealogy tool:
 |
| Each node contains the following information: sex as background color, living/dead state as the node's outline color, genus as the datum background, all of this along with the readily identifiable textual information. |
 | ||||
| Red outline is a dead creature, green is a living one and yellow an exported one.Grendels have green date backround, ettins light yellow, and Norns light brown ones. |
For now I've cheated a bit and am using manually extracted images as the source for creatures pics, but after I show you in an upcoming article how to parse and extract information directly from .s16 files, we will be able to extract those automagically from the photo album files as well.
Isn't it nice to have all the hard data-gathering and formatting work done for us automatically form game data?
No more inaccurate or outdated family trees :) ,it only takes a click to get fully up to date information.And you can run that on as many worlds you want, as many times you want.
You could even schedule regular snapshots of your Norn's population or wolfing runs for later review if you're so inclined.
They're also graphviz components for rendering graphviz data directly inside your web site.
You could even sahre a realtime tree of your Norn population with your visitors.(The Google API features an interface for that, but it's implementation was incomplete last time I checked)
If you're not impressed with graphviz visualisations, you could always dump the raw graph data in a variety of text formats to be later imported into your favorite genealogy tool.
Here's a last screenshot of the Wolfing run we've seen mapped in the Gephi post:
 | |
| "Dot" is a hierarchy oriented renderer, making it particularly suitable for drawing family trees.Without further intervention from us, it aligned Norns by generations. |
 |
| Close up of the graph, showing the tree conveniently ordered by generations |
Going further
Graphviz is a very versatile tool and can be used to represent any kind of graph data in any shape you want.We used it here for genealogy, and as a pretext to reuse one of our preceding file parsing code to illustrate it's usefulness, but there's more you could do:
- Use it to draw your world's timeline from the GameLog file
- Use it to automatically draw a map of all chemicals and reactions happening inside a Norn right from it's genome file.
- Use it to visually map genomes by gene types or organs for easier browsing
- Use it to produce visual diffs between 2 Norn's genomes (show the common part in white, along with added/modified/missing genes color coded by difference type)
- Use it to visualise all scripts of the game scriptorium in a giant map, so you don't waste time manually browsing through vast wastelands of empty scripts by ID.
- Use it to map a cob's components and dependencies for quick anlysis (scripts, images,effects...)
- Your idea here ?
All of these will be covered in upcoming articles once the corresponding pre-requisites get their own articles.
I'm particularly excited about the ability to automatically map out a Norn's biochemistry without having to painfully mess around in a genetics kit to find every single place where a given chemical was used, but there's a couple things I must show you first before we get to that (reversing and parsing the C1 genome files and c2 allchemicals.str files...) do i smell upcoming articles?
References
Graphviz is a very powerful tool, and you could potentially arrange the nodes and graph in any shape you want, and containing any information you like.Obviously, I can't cover all of that here, and you'll have to look up the eye candy stuff by yourself (or wait for my next updates)
So here are some links if you want to dig further down on this topic:
- The graphviz site
- A quick tutorial among many other about basic graphviz usage and customisation
- A complete guide on all you need to know about the "Dot" format we used throughout this post to describe our graphs.If you only could read one thing, read this one.It has usage example for various layouts, timelines, node shaping...
- One of many online graphviz test apps so you can mess around with designing your graph manually before coverting everyhing to python code.
Let me know if you'd like me to give more details about any of this.
Happy graphing !
No comments:
Post a Comment